Tropical deforestation pressure
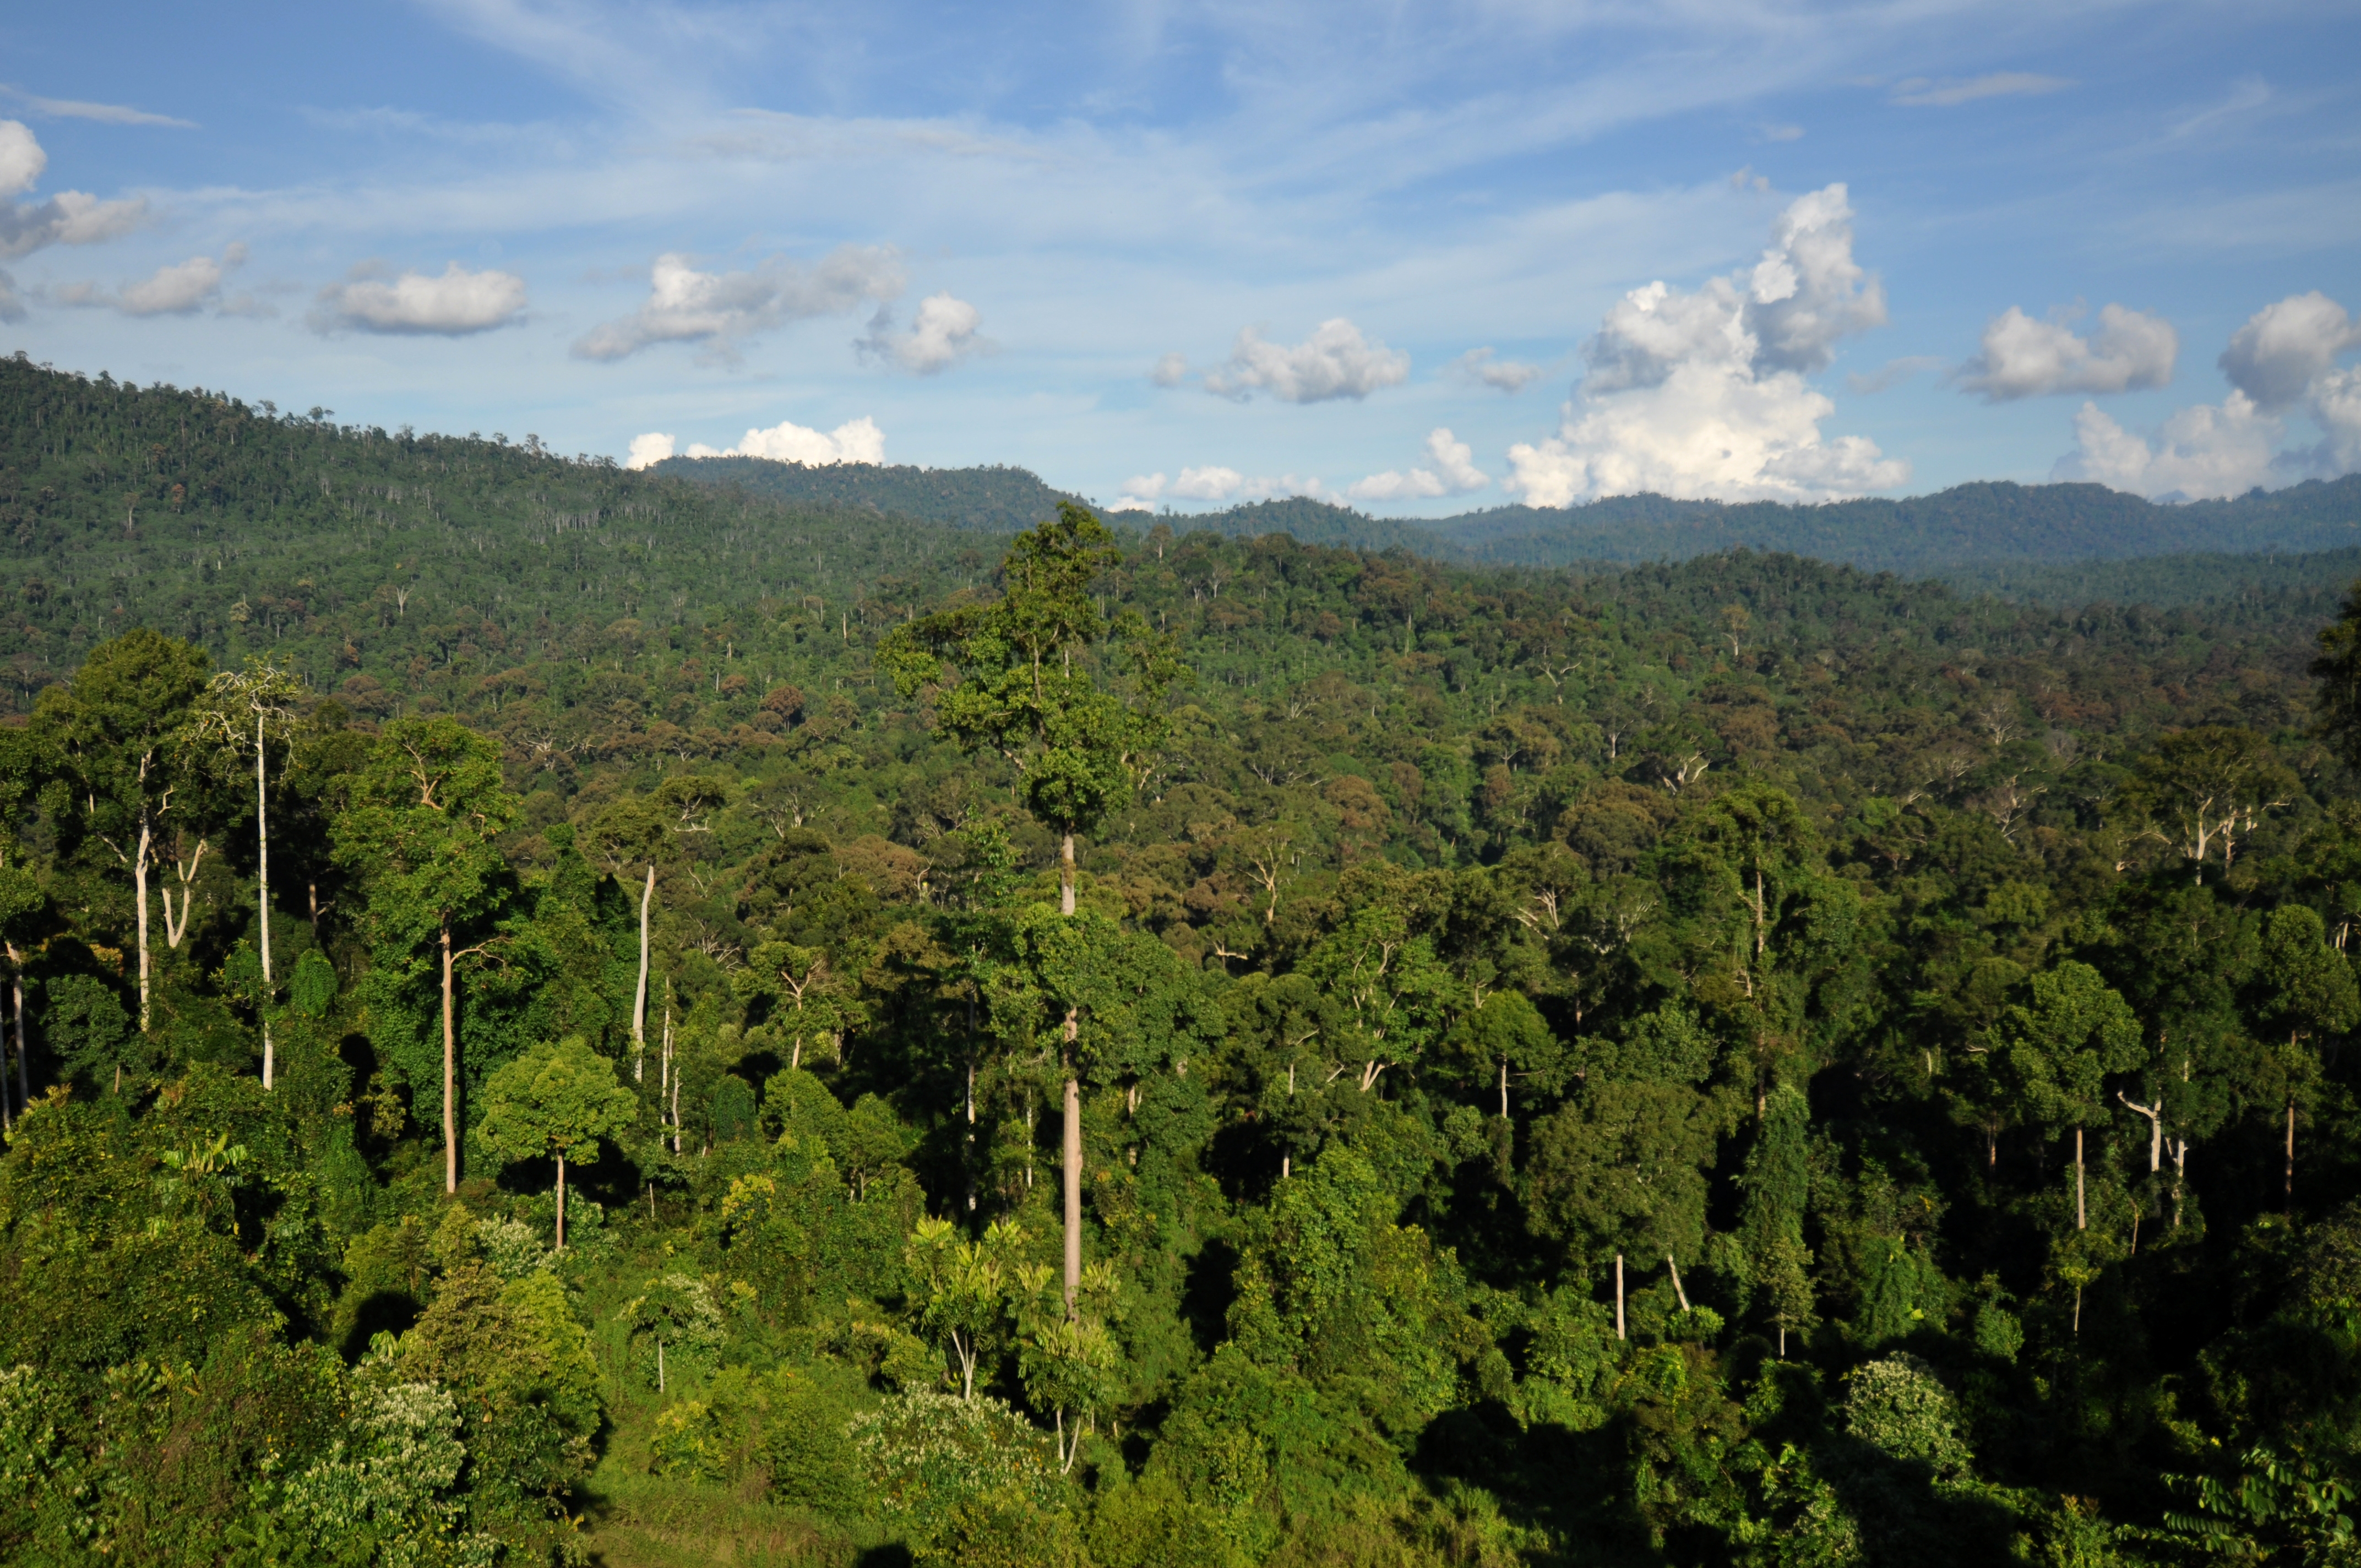
The continuing pressure to clear forests for agriculture, cattle, logging and mining, concentrated in tropical regions such as the Amazon. Its strongest welfare pathway: it strengthens Global CO2 emissions per capita, a worse welfare reading. The most recent of its 21 recorded facts is “Brazil hosts COP30 in Belém” (22 November 2025).
Read the full background
The continuing pressure to clear forests for agriculture, cattle, logging and mining, concentrated in tropical regions such as the Amazon. Deforestation both releases stored carbon (raising emissions) and removes carbon sinks; its intensity rises and falls with enforcement, commodity demand and political will.
What it changes
Indicators this driver moves, strongest relation first. Relation strength is separate from the observed state.
Strengthens · 40% impact strength
Observed
4.73 tonnes CO2 per person per year · 2.43 above the normal line (2024)
Worse than normalTwo readings: 4.71 tonnes CO2 per person per year (2023) and 4.73 tonnes CO2 per person per year (2024).
20232024 Above normal = worse · Lag ~12 mo · Relation verified
Strengthens · 25% impact strength
Observed
32.9 micrograms per cubic metre (annual mean, population-weighted) · 27.9 above the normal line (2023)
Worse than normal3 readings, 2021–2023: fell from 33.2 micrograms per cubic metre (annual mean, population-weighted) to 32.9 micrograms per cubic metre (annual mean, population-weighted).
Above normal = worse · Lag ~6 mo · Relation verified
Key facts moving this driver
Ranked by impact weight, then verification, then recency.
- Amazon and Pantanal fire seasons remain severe despite 2023 deforestation drop1 September 2024 · Strengthening · impact weight 0.5
- Forest loss and jade-and-timber extraction continue on NLD watch1 November 2019 · Strengthening · impact weight 0.45
- Ibama licences the Belo Monte dam in Lula’s second term1 February 2010 · Strengthening · impact weight 0.45
- Prabowo allocates Rp48.8 trillion to continue Jokowi’s Nusantara capital21 January 2025 · Strengthening · impact weight 0.35
- Brazilian Amazon deforestation falls sharply after 20231 October 2025 · Weakening · impact weight 0.75
- Brazil reverses Amazon deforestation through renewed enforcement under Marina Silva (2023-2024)7 August 2024 · Weakening · impact weight 0.7
- INPE records a sharp drop in Amazon deforestation in Lula’s first year back31 December 2023 · Weakening · impact weight 0.65
- Union adopts the EU deforestation regulation31 May 2023 · Weakening · impact weight 0.6
Accountability & contradictions
A view of the graph: opposing facts, the actors behind them, and what is disputed.
What strengthened it
What weakened it
Driver over time
The dated facts recorded on this driver, oldest first.
1 February 2010 · Strengthening
Ibama licences the Belo Monte dam in Lula’s second term1 November 2019 · Strengthening
Forest loss and jade-and-timber extraction continue on NLD watch31 May 2023 · Weakening
Union adopts the EU deforestation regulation29 June 2023 · Weakening
EU adopts the Deforestation Regulation (EUDR) on deforestation-free products (2023)31 December 2023 · Weakening
INPE records a sharp drop in Amazon deforestation in Lula’s first year back17 June 2024 · Weakening
EU adopts the Nature Restoration Law (2024)24 June 2024 · Weakening
Union adopts the Nature Restoration Law7 August 2024 · Weakening
Brazil reverses Amazon deforestation through renewed enforcement under Marina Silva (2023-2024)1 September 2024 · Strengthening
Amazon and Pantanal fire seasons remain severe despite 2023 deforestation drop1 October 2025 · Weakening
Brazilian Amazon deforestation falls sharply after 2023
Causal path
Facts move the driver; the driver moves indicators. Open the full network to inspect each link.
- Facts21 recorded
- moveDriverTropical deforestation pressure
- strengthensIndicators (2)Global CO2 emissions per capita
Evidence
Review status of the facts behind this driver.
Documented Feb 2010 – Nov 2025
How Factrail grades evidenceBy the Factrail desk · Method: how we source and score · Last reviewed · Sources: 20
Questions
Who is responsible for Tropical deforestation pressure?
Factrail's graph links Luiz Inácio Lula da Silva, Frans Timmermans, and Ursula von der Leyen to Tropical deforestation pressure through sourced facts.
When did Tropical deforestation pressure start?
1 February 2010: Ibama licences the Belo Monte dam in Lula’s second term.
How does Tropical deforestation pressure affect people?
It is linked to Global CO2 emissions per capita and Population-weighted PM2.5 air pollution exposure (global) in Factrail's graph.