WHO estimates 14.9 million excess deaths associated with the pandemic in 2020–2021
WHO published an estimate of approximately 14.9 million excess deaths associated directly or indirectly with the COVID-19 pandemic during 2020 and 2021, with an uncertainty range of 13.3 million to 16.6 million. In the causal graph this event strengthens COVID-19 pandemic, a driver that weakens Life expectancy at birth — a worsening welfare path.
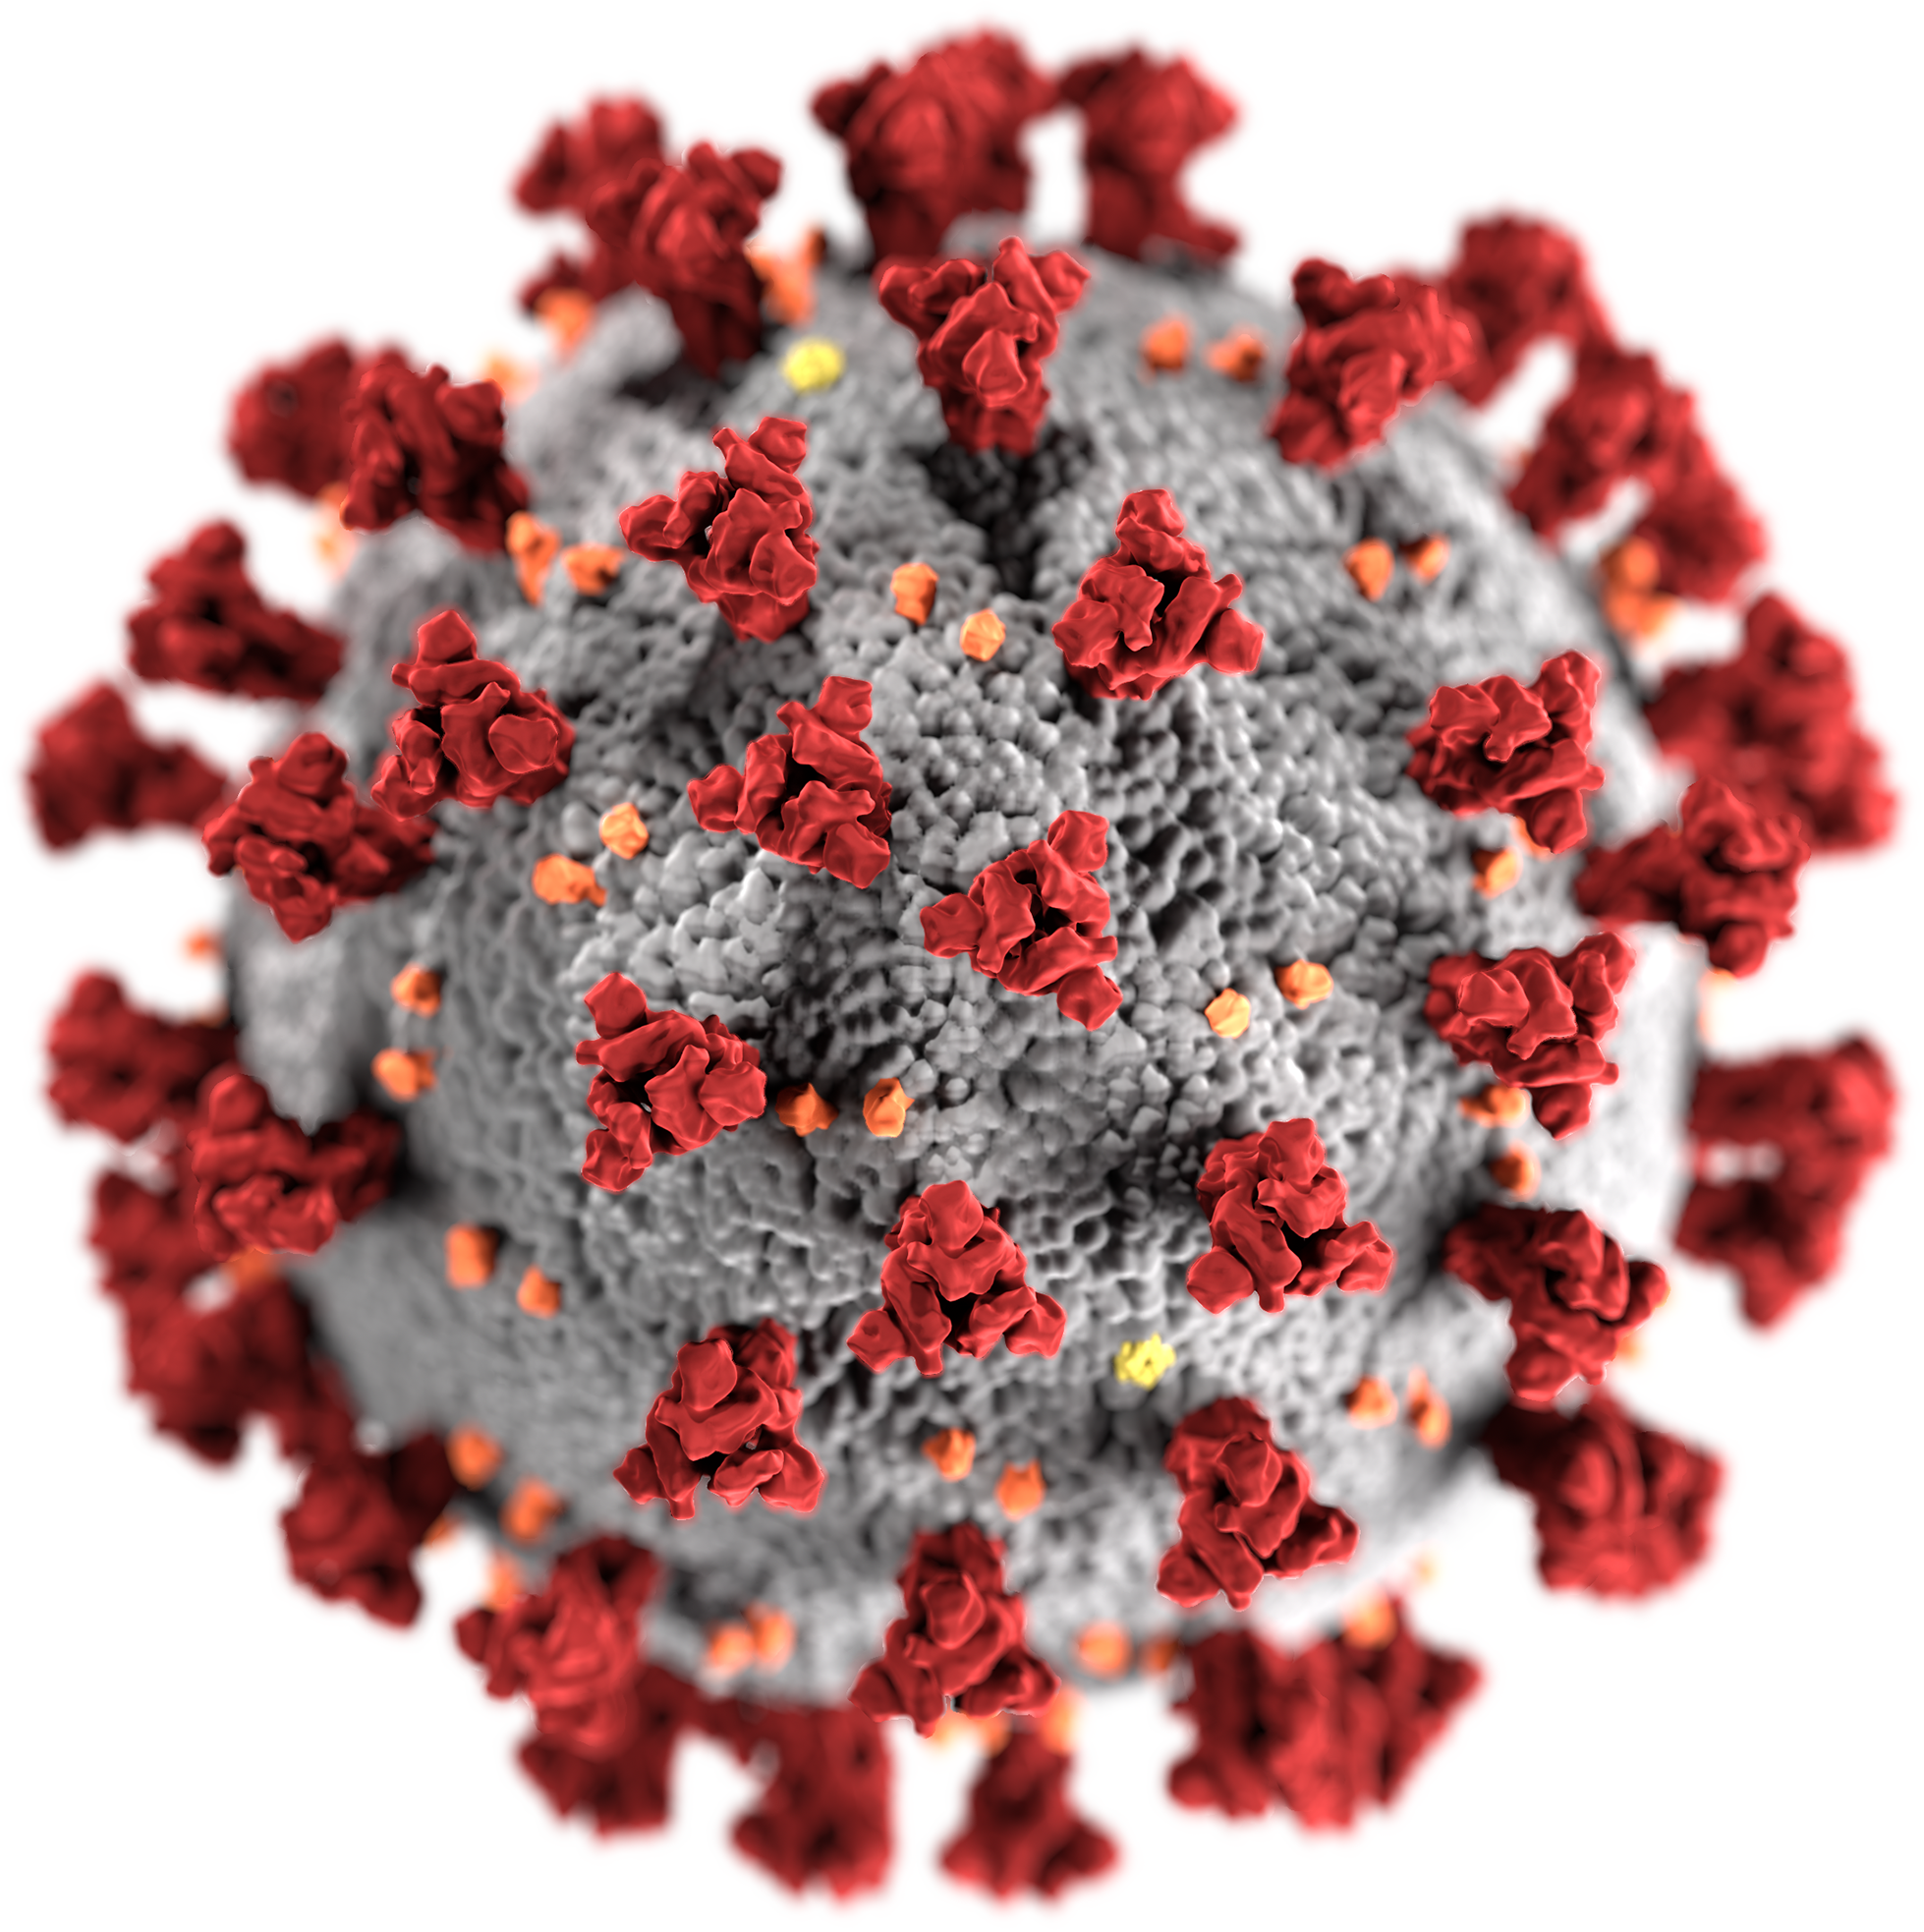
Read the full account
WHO published an estimate of approximately 14.9 million excess deaths associated directly or indirectly with the COVID-19 pandemic during 2020 and 2021, with an uncertainty range of 13.3 million to 16.6 million. This is an outcome measurement of the pandemic's scale, not a new transmission event and not a person-level responsibility allocation.
Who was responsible
Contribution type and responsibility level for each recorded actor — not sole-author shorthand.
No public contributors are listed for this fact.
What changed
Fact → Driver → Indicator. Relationship strength orders the paths; it is not the observed indicator movement.
- FactWHO estimates 14.9 million excess deaths associated with the pandemic in 2020–2021
- strengthensDriverCOVID-19 pandemic
- weakensIndicators (3)Life expectancy at birth
impact weight 0.4 · verified
Outcome evidence documenting severity. Keep impact weight null. [impact_weight null in pack → provisional 0.4 stored only because fact_driver_impacts.impact_weight is NOT NULL; not a sourced magnitude]
Weakens · Relationship strength 0.3 (weight 0.4 × strength 0.75)
Observed
80 Years · 2.3 below the normal line (2023)
Worse than normal6 readings, 2018–2023: rose from 79.5 Years to 80 Years.
Above normal = better
Strengthens · Relationship strength 0.28 (weight 0.4 × strength 0.7)
Observed
37.4 deaths per 1,000 live births · 12.4 above the normal line (2024)
Worse than normal7 readings, 2018–2024: fell from 40 deaths per 1,000 live births to 37.4 deaths per 1,000 live births.
Above normal = worse
Weakens · Relationship strength 0.26 (weight 0.4 × strength 0.65)
Observed
84% of one-year-olds · 11 below the normal line (2024)
Worse than normal7 readings, 2018–2024: fell from 86.4% of one-year-olds to 84% of one-year-olds.
Above normal = better
Causal path
How this event connects to drivers and indicators in the graph.
- FactWHO estimates 14.9 million excess deaths associated with the pandemic in 2020–2021
- strengthensDriverCOVID-19 pandemic
- weakensIndicatorLife expectancy at birth
Cite this page
Factrail. (2026). WHO estimates 14.9 million excess deaths associated with the pandemic in 2020–2021. Factrail. https://factrail.ai/facts/covid-excess-mortality-estimate-2022-05-05
https://factrail.ai/facts/covid-excess-mortality-estimate-2022-05-05
Accessed 15 October 2026.
By the Factrail desk · Method: how we source and score · Last reviewed
Dispute this factNamed here, or represent someone who is? Request a right of reply.