Sweating sickness years disrupt More’s household and court attendance
In the later 1520s sweating sickness waves disrupted London households and court routines intersecting More’s career and Chelsea life. In the causal graph this event strengthens Infectious-Disease Transmission, a driver that weakens Life expectancy at birth — a worsening welfare path.
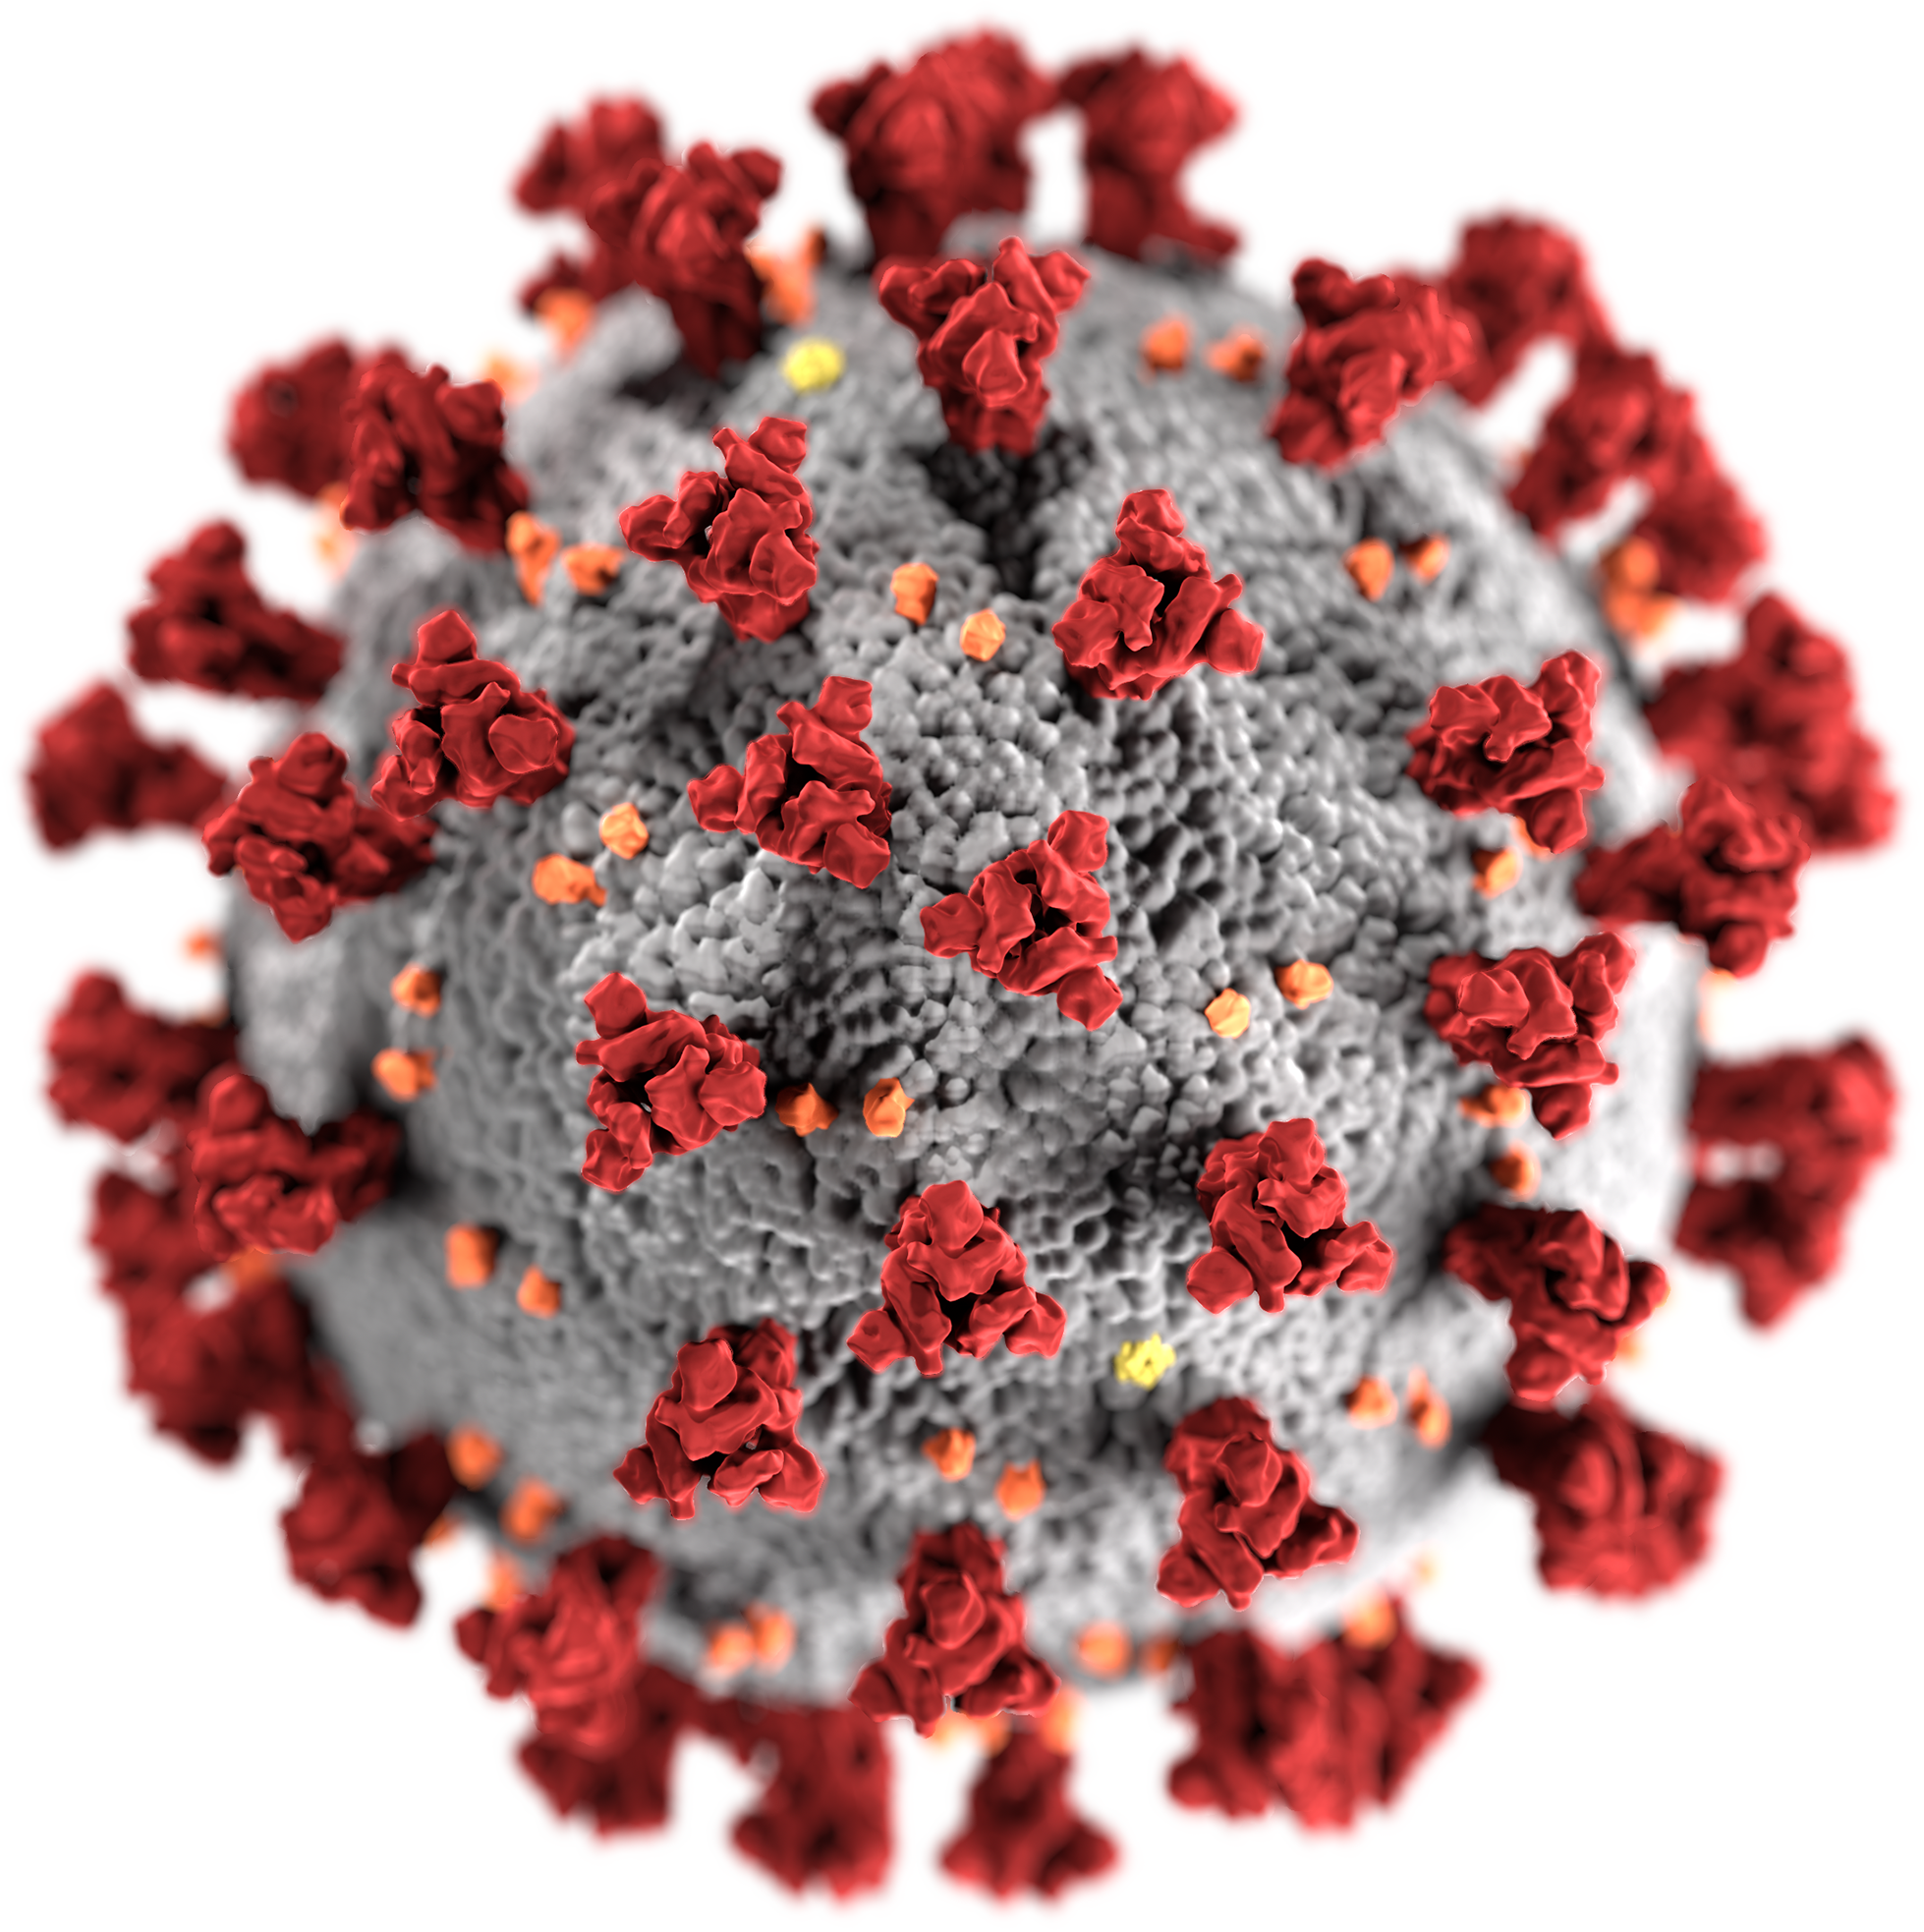
Read the full account
In the later 1520s sweating sickness waves disrupted London households and court routines intersecting More’s career and Chelsea life. The instrument is that epidemic disruption, not a claim he caused infection.
Context
Tudor epidemic years are public. Britannica and BHO calendars independently place sweating sickness in Henry’s reign. Unique household death lists are not invented without names in sources.
Thomas More’s documented role is bounded by other offices and collaborators named in the sources below.
Conventional years are 1478–1535. Surviving public files are later parliamentary biographies, HRP pages, Yale Essential More, and encyclopedias. More did not typeset those later pages. Posthumous canonisation is reception, not a lifetime act.
Why it matters
Infectious-disease path. Medium-high confidence on career disruption pattern.
Who was responsible
Contribution type and responsibility level for each recorded actor — not sole-author shorthand.
Thomas More
PersonDirect responsibility
responsibility level 0.4 · verified
Epidemic waves hit London and court. Household members share risk.
What changed
Fact → Driver → Indicator. Relationship strength orders the paths; it is not the observed indicator movement.
- FactSweating sickness years disrupt More’s household and court attendance
- strengthensDriverInfectious-Disease Transmission
- weakensIndicators (3)Life expectancy at birth
impact weight 0.5 · Effect from 1 January 1528 · verified
Weakens · Relationship strength 0.25 (weight 0.5 × strength 0.5)
Observed
80 Years · 2.3 below the normal line (2023)
Worse than normal6 readings, 2018–2023: rose from 79.5 Years to 80 Years.
Above normal = better
Weakens · Relationship strength 0.25 (weight 0.5 × strength 0.5)
Observed
37.4 deaths per 1,000 live births · 12.4 above the normal line (2024)
Worse than normal7 readings, 2018–2024: fell from 40 deaths per 1,000 live births to 37.4 deaths per 1,000 live births.
Above normal = worse
Strengthens · Relationship strength 0.2 (weight 0.5 × strength 0.4)
Observed
11% of primary-school-age children · 11 above the normal line (2023)
Worse than normalAbove normal = worse
Evidence
The sources behind this fact and its verification state.
- 1.Britannica — Thomas MoreEncyclopaedia Britannica · High credibility · verified
- 2.British History Online — calendars of Henry VIII papersInstitute of Historical Research / BHO · High credibility · verified
What the sources establish
Britannica and British History Online independently note sweating sickness crises in the late 1520s court world.
Established: sweating sickness struck Tudor London/court in these years. Not established: a pathogen genome from More’s house.
Thomas More did not file a later UNESCO form, a later Loeb colophon, or a later museum label as a personal act. Sweat is not heresy enforcement. Keep infection off the Chancellor raids row.
Causal path
How this event connects to drivers and indicators in the graph.
- ActorThomas More
- contributed toFactSweating sickness years disrupt More’s household and court attendance
- strengthensDriverInfectious-Disease Transmission
- weakensIndicatorLife expectancy at birth
Cite this page
Factrail. (2026). Sweating sickness years disrupt More’s household and court attendance. Factrail. https://factrail.ai/facts/tm-infect-sweating-sickness
https://factrail.ai/facts/tm-infect-sweating-sickness
Accessed 16 October 2026.
By the Factrail desk · Method: how we source and score · Last reviewed
Dispute this factNamed here, or represent someone who is? Request a right of reply.